Technoboot
Software, Data and Design Work, Explained Step by Step
What happens inside a web build, an app release, a reporting stack or a brand kit: the order the work runs in, what a client should hold at the end, and the mistakes that repeat across projects.
Each section covers one kind of work. No pricing and no timelines — those belong to a specific project. The process does generalise, and that is what is written down here.
Section 01
Website Development
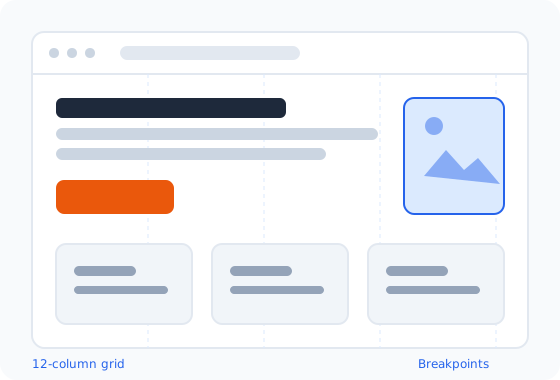
A website is three problems stacked together: what it has to accomplish, how content is structured so a visitor reaches it in a step or two, and how it is built so it loads fast and survives being edited by non-developers.
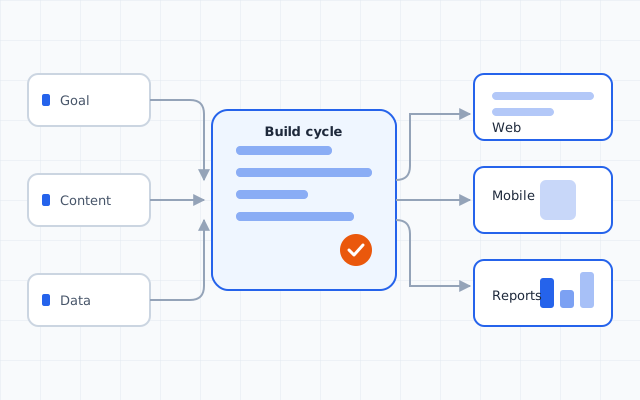
A workable order: agree the goal and audience, gather the real text and images, map them into page types and fields, design templates around that structure, build the front end, connect a content management system, then test on mid-range phones before launch.
- Source code and database in a repository the client owns.
- Domain, hosting and certificate registered in the client's name.
- A written content model: which page types exist, which fields each has.
Recurring mistake: approving a design drawn on invented text. Layouts built around neat sample sentences break when real headings and long product names arrive.
Worth asking a contractor: is the output standard code or a builder only they can maintain, and what transfers if the relationship ends.
Section 02
Mobile Applications
An app differs from a website in one decisive way: the user decides when to update it. Old versions stay installed for months, so server changes must keep working for clients released a year earlier.
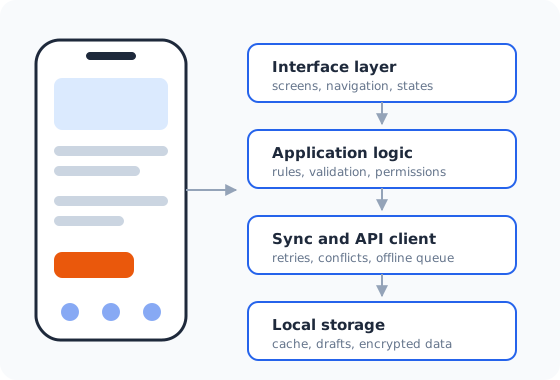
Native suits apps leaning on camera, sensors or background work; a shared codebase suits apps that are mostly forms, lists and content. Either way the architecture separates interface, rules, synchronisation and storage, so a phone losing signal mid-action does not lose the action.
- Signing keys and store accounts held by the client, not the developer.
- Crash reporting connected before the first public release.
- Tested behaviour for offline use and for failed uploads.
Common shortcut that backfires: shipping a wrapped website as an app. It passes a demo and fails in use: no offline state, sluggish scrolling, and a store review that may reject it.
Section 03
Custom Software Solutions
Custom software earns its cost when a standard product forces a business to work against its own process. Otherwise it rarely does: maintenance, not the first release, is where the money goes.
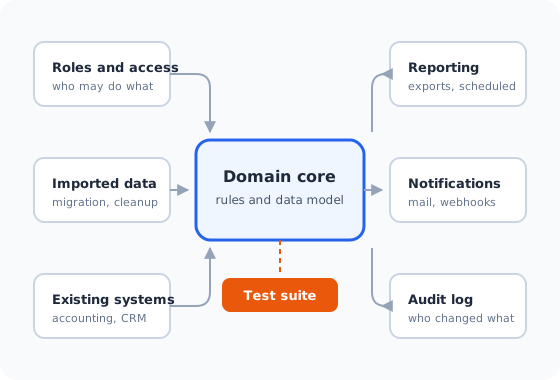
The valuable early work describes rules, not screens. "An order cannot ship before payment clears, except for these account types" is a rule; a drawing of an order screen is a guess at how it might look. Rules can be tested automatically, drawings cannot.
- A written data model and the rules that constrain it.
- Migration of existing records, rehearsed before the real run.
- Deployment scripts and a runbook for backups and restores.
Worth insisting on: permissions designed at the start. Retrofitting who may see what into a system that assumed every user is trusted means touching nearly every query.
Section 04
Analytics and Business Intelligence
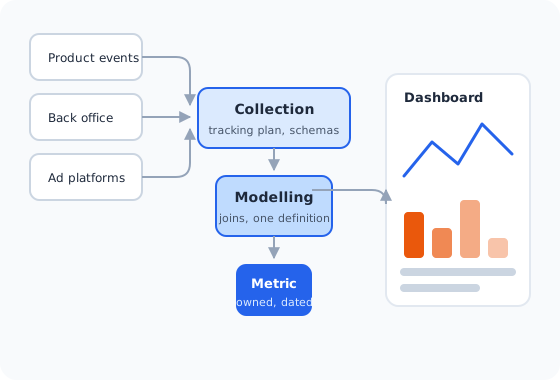
Reporting runs in one direction: collection, storage, modelling, presentation. The dashboard is the last step and the least interesting. If events are missing or arriving twice, a good chart renders the wrong number convincingly.
Start from the decisions the numbers support, then define each metric in writing: what counts, what is excluded, which timezone, who owns it. A metric two departments define differently produces two answers and a standing argument.
- A tracking plan: which events exist and what each one carries.
- A documented definition and a named owner for every headline metric.
- Access to the underlying data, not only the finished charts.
Order that gets reversed: building the dashboard first and validating the data later. Once a chart has been shown in a meeting it becomes the reference.
Section 05
Graphic Design and Visual Identity
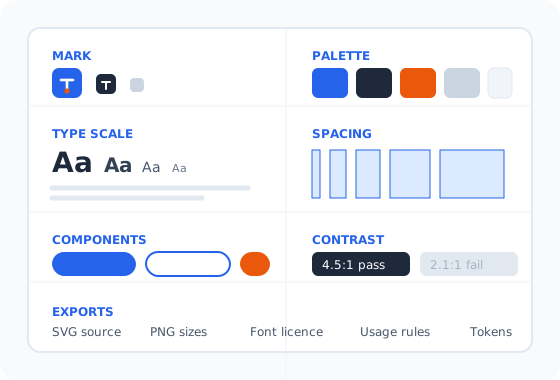
Identity work produces a system, not a picture. A mark gets resized, placed on dark backgrounds, printed in one colour and squeezed into a browser tab. What survives that is a set of rules plus editable source files.
The same holds for interface design. A usable design system fixes a spacing scale, a type scale, colour tokens with tested contrast, and the states every component can be in: default, hover, focused, disabled, loading, empty, error.
- Editable source files, not only flattened exports.
- Font licences covering web, app and print, held by the client.
- Text colour pairs at a contrast ratio of at least 4.5 to 1.
Worth checking early: whether the mark still reads at 16 pixels in a single colour. Gradients and thin strokes look excellent in a presentation and vanish on an invoice.
Section 06
Digital Marketing
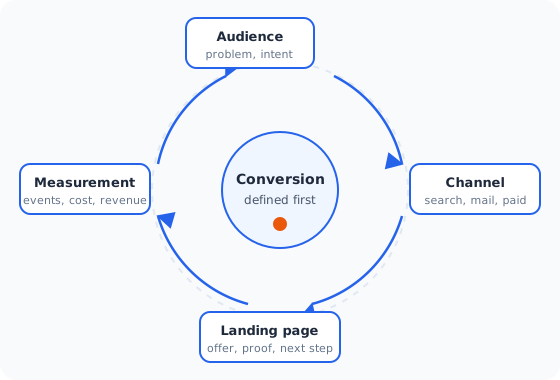
Marketing becomes measurable only after somebody decides what a result is. Traffic is not a result; an enquiry, an order or a booked call is. Until that event is recorded reliably, every report describes activity rather than outcome.
After that the loop is short: pick an audience defined by a problem, reach it where the problem is already expressed, send it to a page answering that problem in its first screen, measure, then change one thing at a time.
- Advertising and analytics accounts owned by the client from day one.
- A conversion definition agreed in writing before spending starts.
- Reports that include cost, volume and the raw export behind them.
Costly to unwind: an agency owning the ad account and the history. When the contract ends the history ends with it, and the next team starts with no baseline.
Section 07
Early Stage Products and Technical Consulting
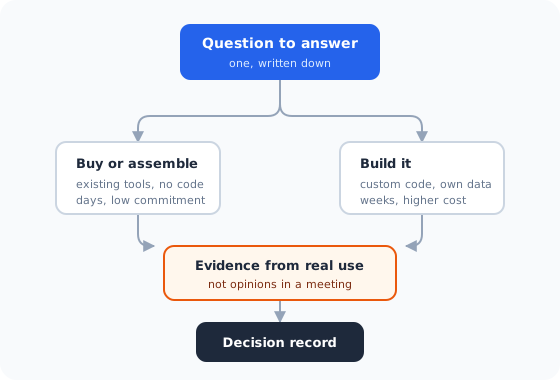
At an early stage the constraint is uncertainty, not engineering capacity. The useful question is which single assumption, if wrong, makes everything else pointless, and what the cheapest honest test of it is.
When building is the right answer, scope smaller than feels comfortable, pick technology that can be hired for locally, and keep the data model clean while the interface stays crude: interfaces are cheap to replace, accumulated bad data is not.
- One written question per experiment, with the answer that would end it.
- A build-or-buy comparison including the cost of maintaining the build.
- Decisions recorded with their reasoning, so evidence can overturn them.
Section 08
How Work on a Project Is Organised
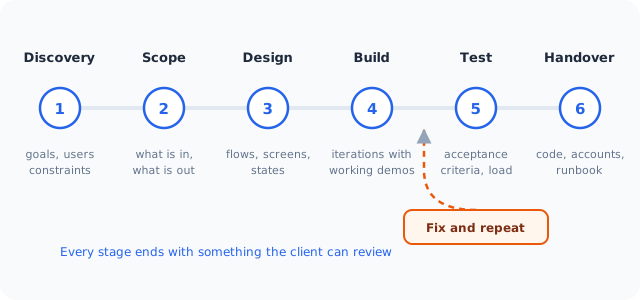
Whatever the discipline, the shape is similar. Each stage should end in something the client can review: a document, a clickable flow, a running build. A stage ending only in a status update cannot be verified, and that is where estimates go wrong.
-
Discovery
Goals, users, existing systems, and the constraints that cannot move: deadlines, budget, regulation.
-
Scope and Estimate
What is included and, more usefully, what is excluded. Estimates as ranges, with their assumptions.
-
Design and Structure
Flows, screen states and data structure agreed before the expensive work starts.
-
Iterative Build
Short cycles ending in a working demonstration. Version control and automated builds from day one.
-
Testing and Acceptance
Acceptance criteria written with the specification, so done is a check rather than an opinion.
-
Handover
Code, credentials, infrastructure access and a runbook another team could work from.
The question worth asking at every stage: if this relationship ended tomorrow, could someone else continue? The answer depends on account ownership, readable code and written decisions.